
Reference layers allow you to display static spatial data—either point data or polygons—that does not exist in your Power BI data model. There are two types of reference layers: a point reference layer and a polygon reference layer. These layers can be overlaid on top of your primary Power BI data, whether you are visualizing sales territories, point-based location data, or both. Each reference layer is maintained in the EasyTerritory Web Portal and is rendered dynamically in the visual at run time.
For example, in a field service scenario, you may want to display warehouse locations as a point reference layer while your Power BI model provides live service-call locations or territory polygons. Reference layers make it easy to combine static spatial context with dynamic Power BI data.
Point Reference Layer
Setup Steps
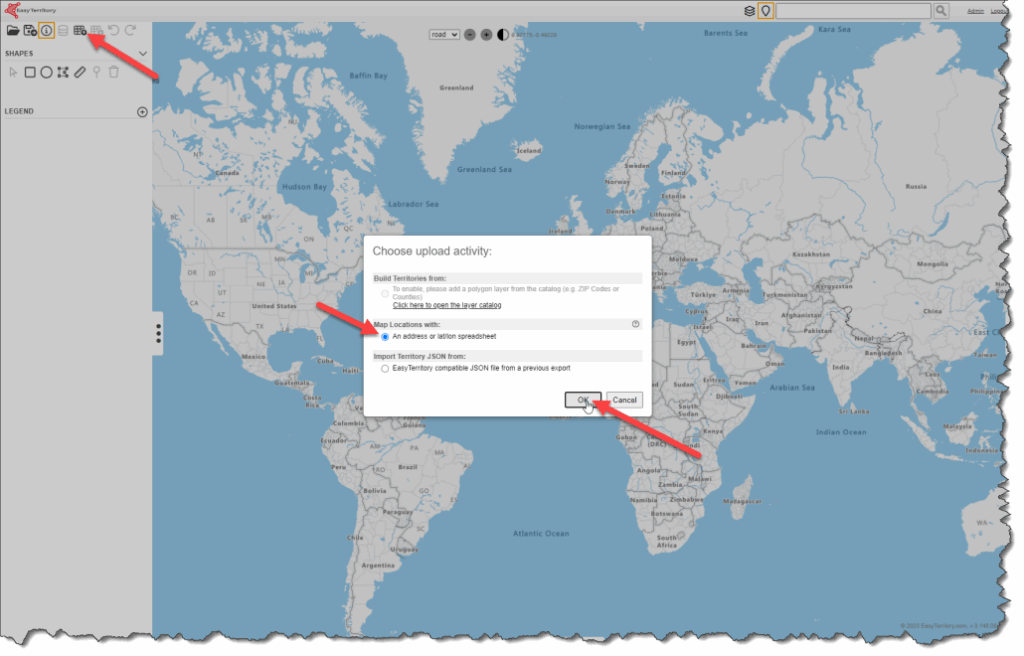
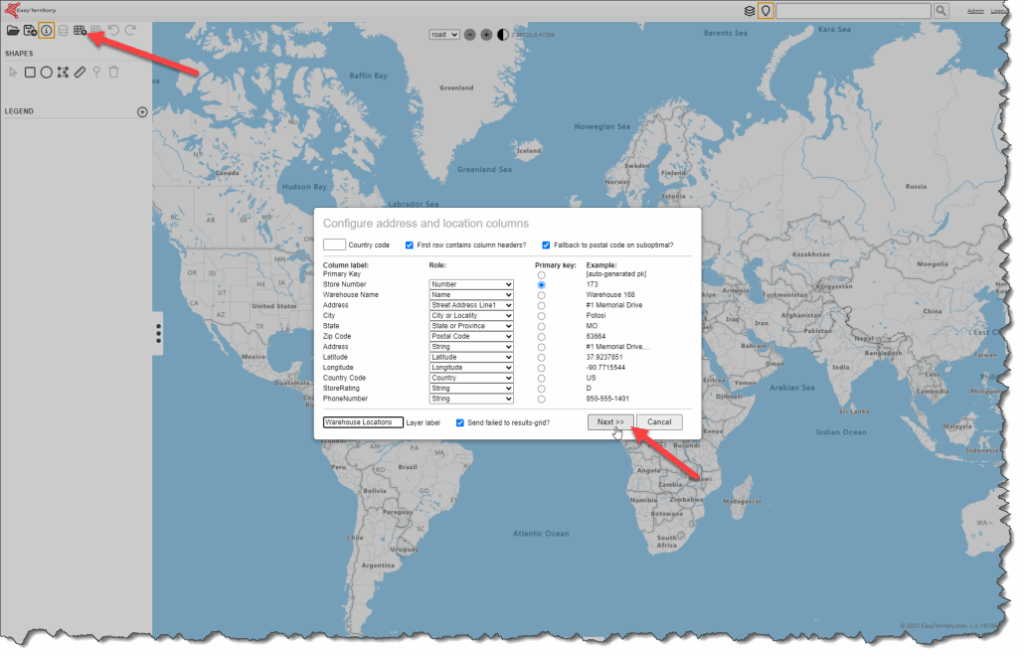
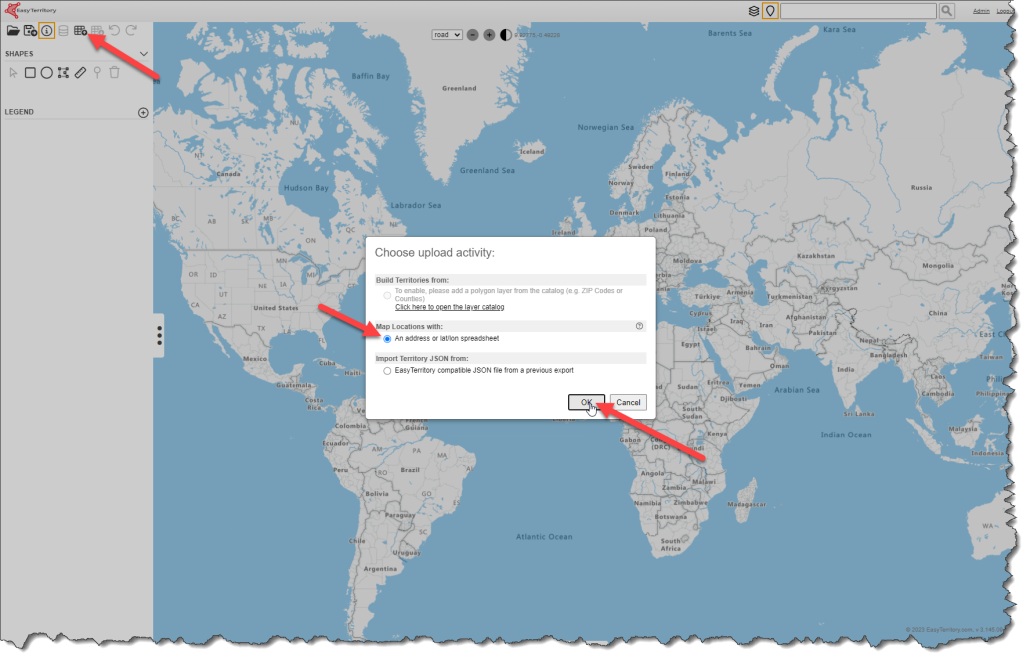
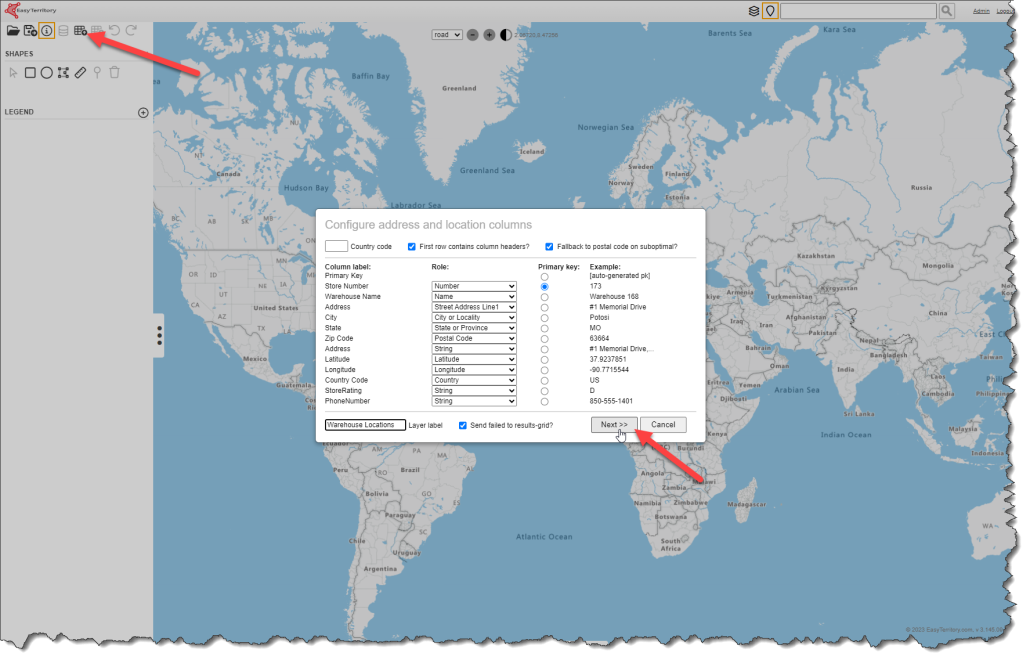
Step 1. Upload your point layer into a new project in the EasyTerritory web portal.
PLEASE NOTE: This must be separate project than your territory project. Additionally, each reference layer should be its own layer (upload) in the project. The Territory Visual does not currently support the Auto-Classification from an EasyTerritory Project.
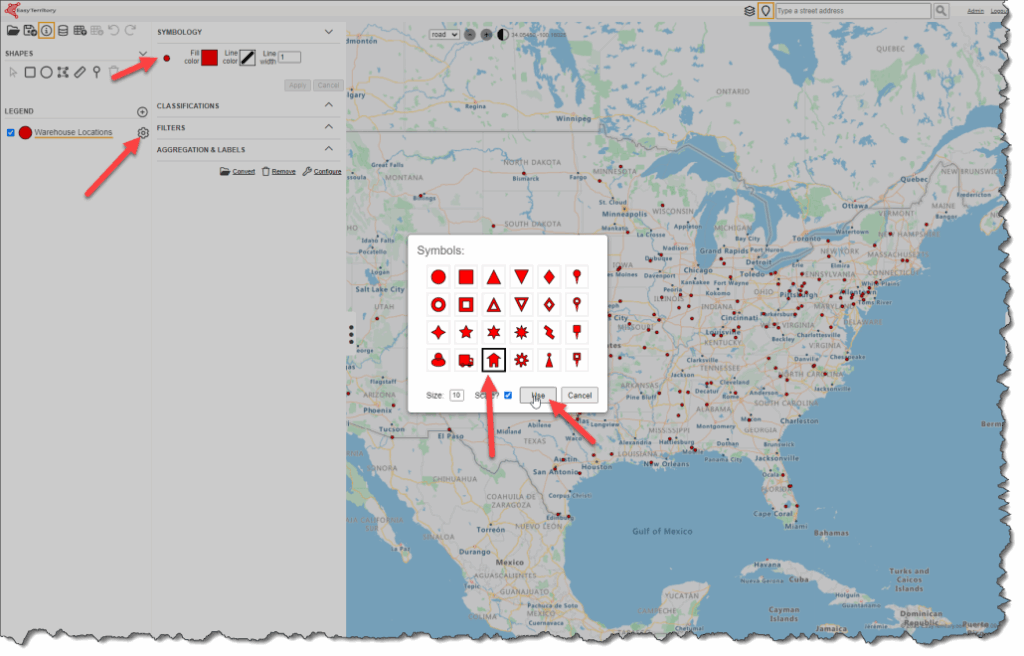
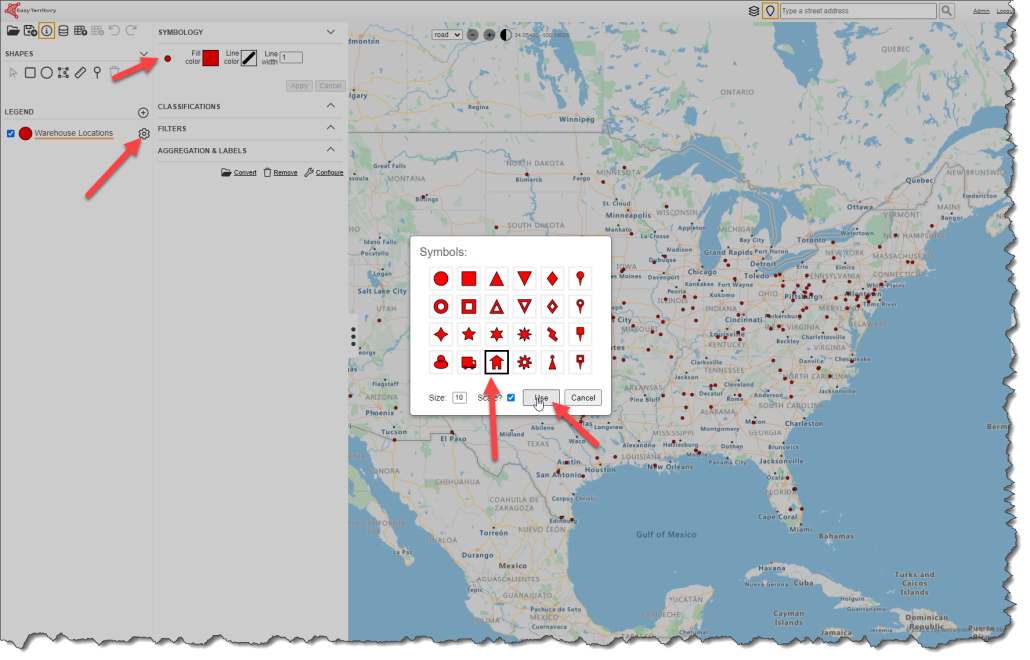
Step 2. Set your point symbology for the reference layer. You can choose any symbol from the symbol library. Adjust the color and size. Size 10 translates to a good default size in the Territory Visual.
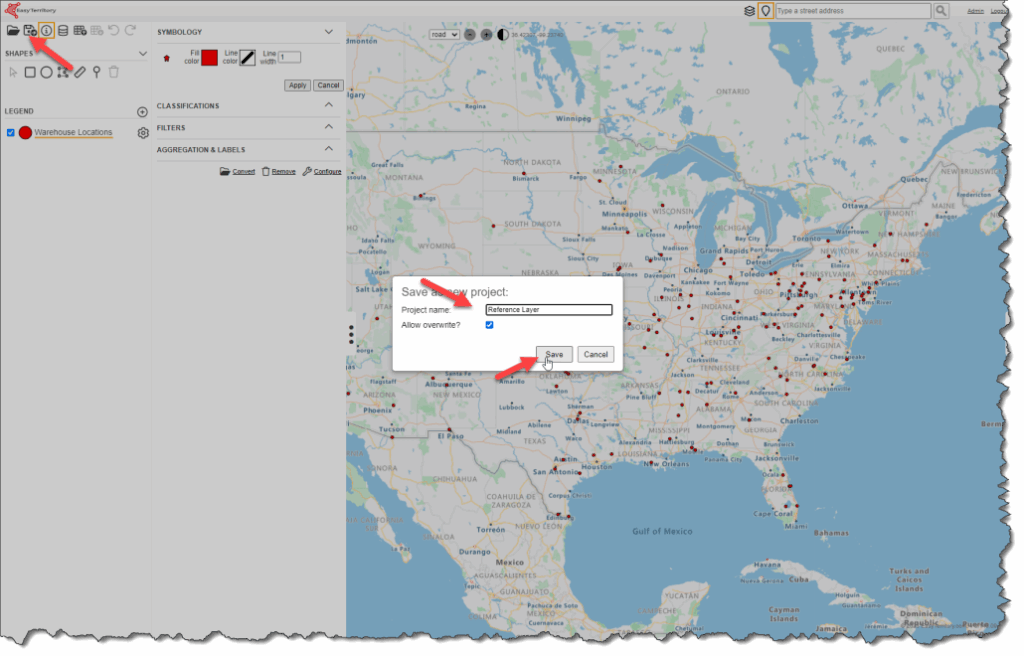
Step 3. Save the new project and copy the new project ID to your clip board.
Step 4. In the Admin Panel of the EasyTerritory Web Portal, configure a Project Plugin with your Project ID.
Name: Description of the project.
Assembly: OpenIntel.Plugins.SaveProjectLayers
Class: OpenIntel.Plugins.SaveProjectLayers.PostProjectSave
Project ID: Project ID with the reference layers.
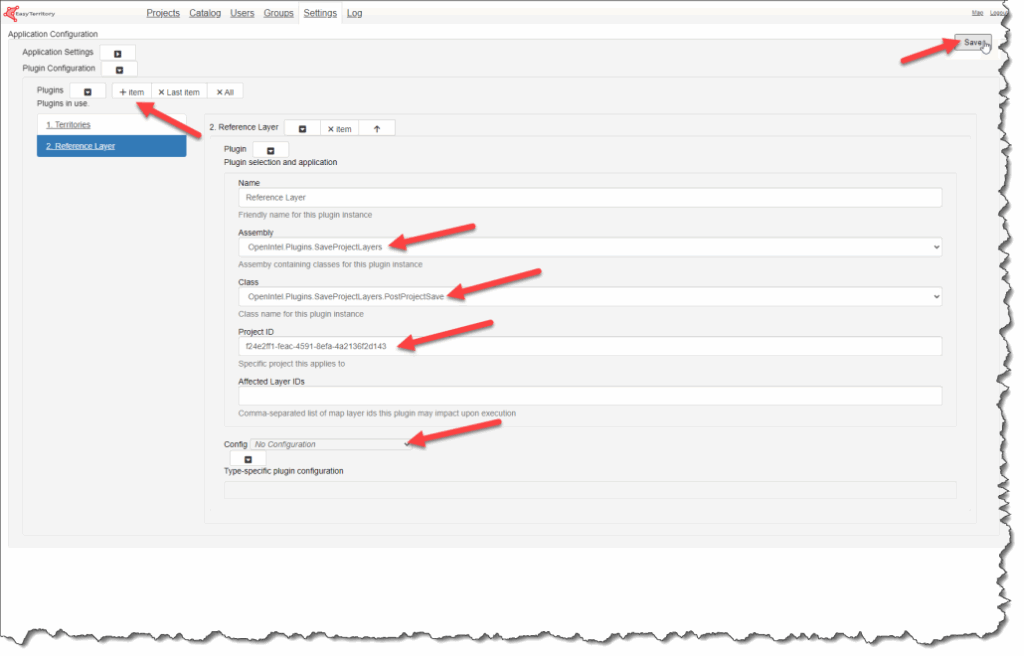
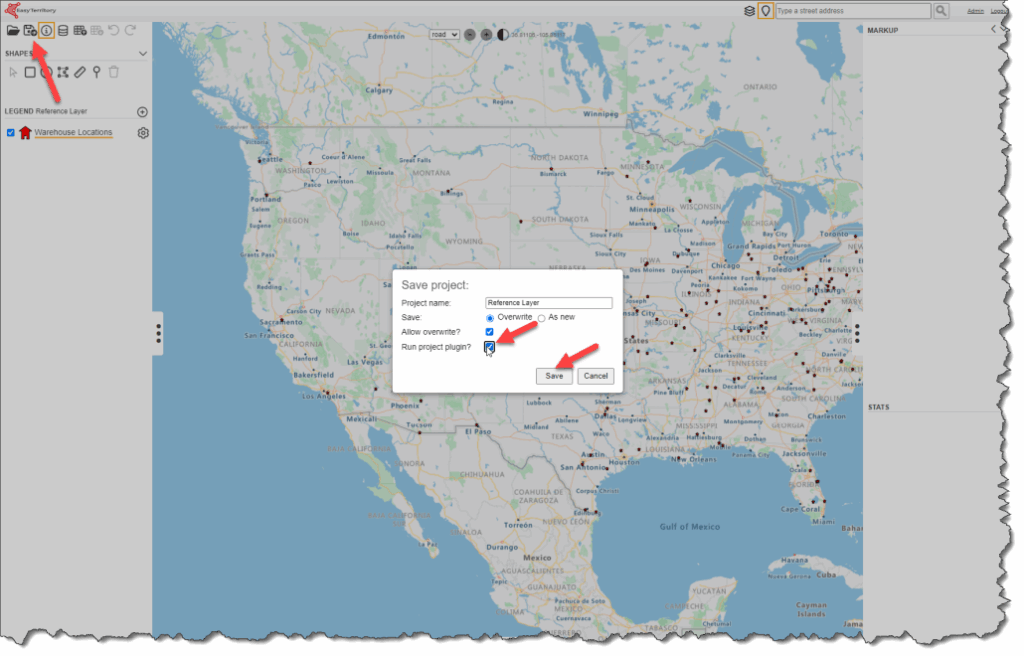
Step 5. Reload the project and save again selecting the Run Project Plugin option. You should see a status in the lower left corner of the application.
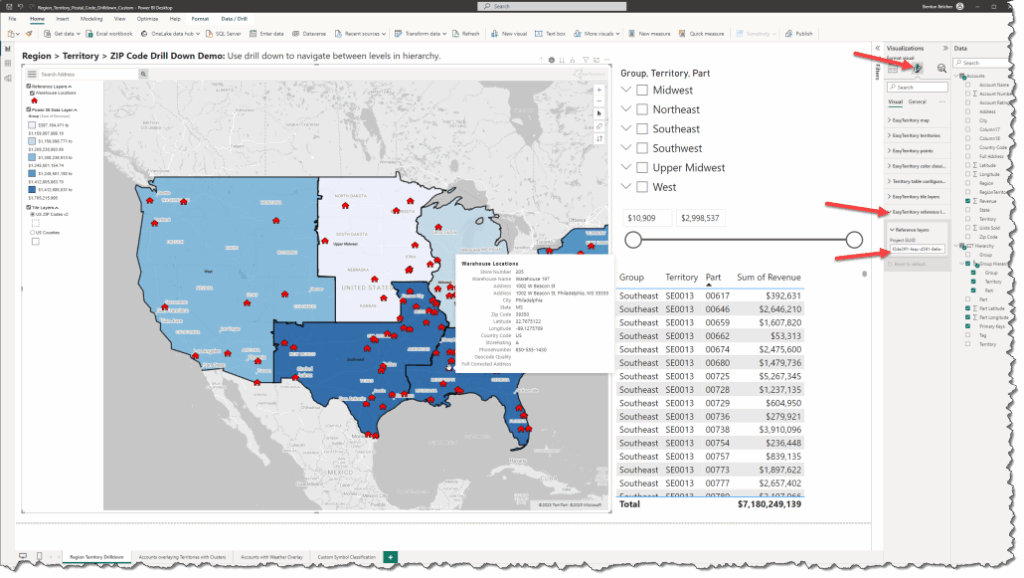
Step 6. In Power BI, select the Territory Visual and set the Project ID property in the Reference Layers section of the Format Panel
Polygon Reference Layer
Step 1: In the EasyTerritory Web Application after building your polygons, in the right-hand corner of the markup panel, select the gears icon ![]()   to launch the workflow dialog.
  to launch the workflow dialog.
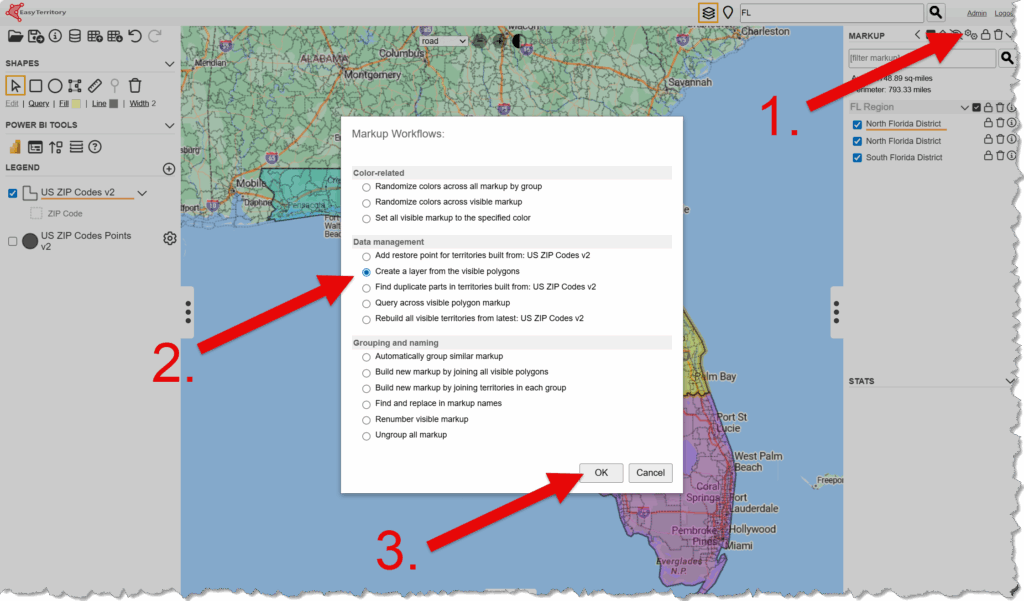
Step 2: After the workflow dialog opens, select the ‘Create a layer from the visible polygons’ radio button and then click OK.
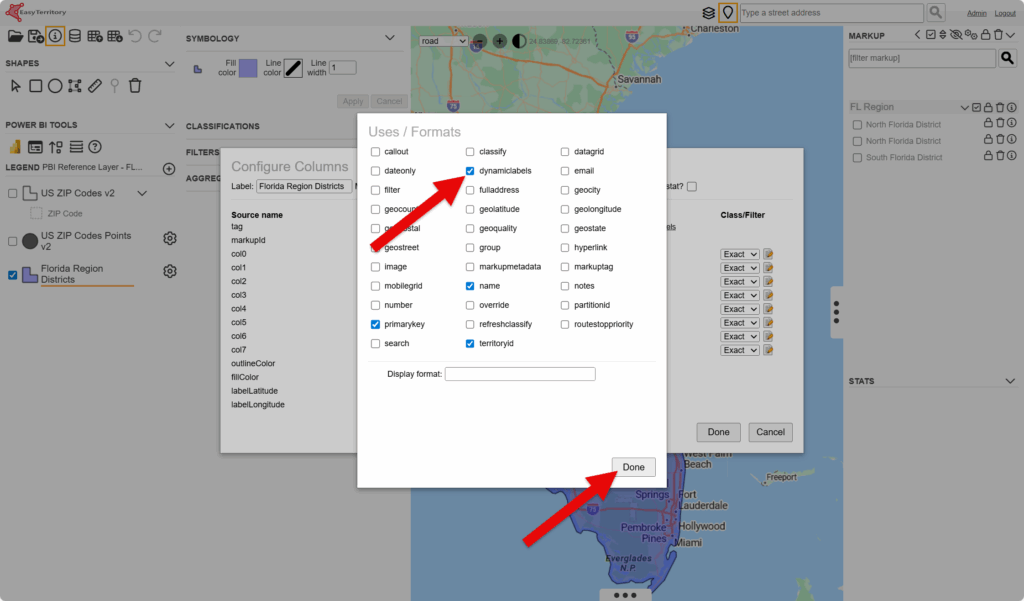
Step 3: EasyTerritory will convert this markup to a layer and the configure columns dialog will be displayed. Here you can change the name or your layer, and set which columns you want to be included in the tool tip/ callouts in the Power BI Territory Visual.
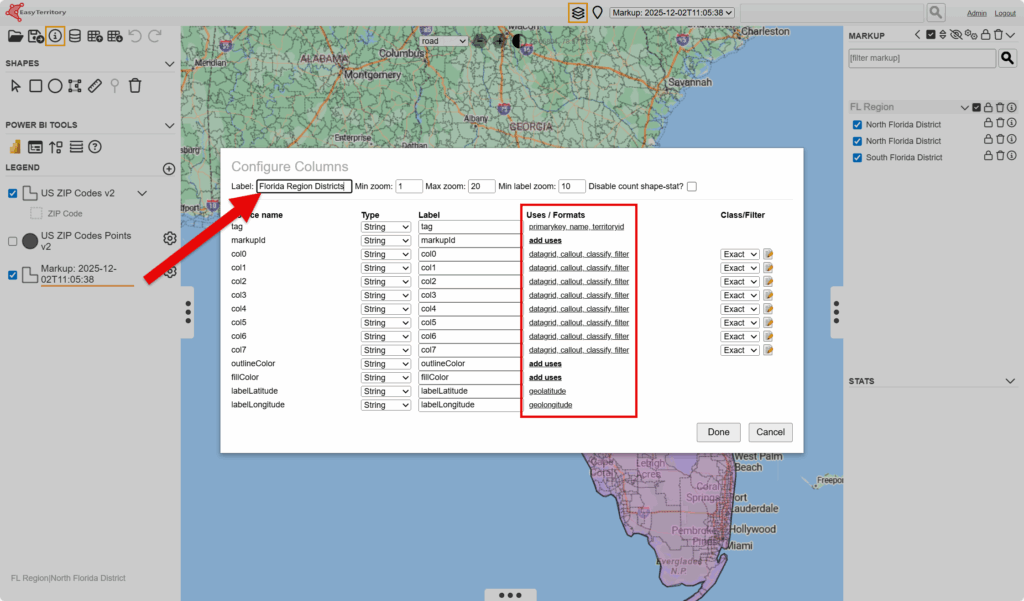
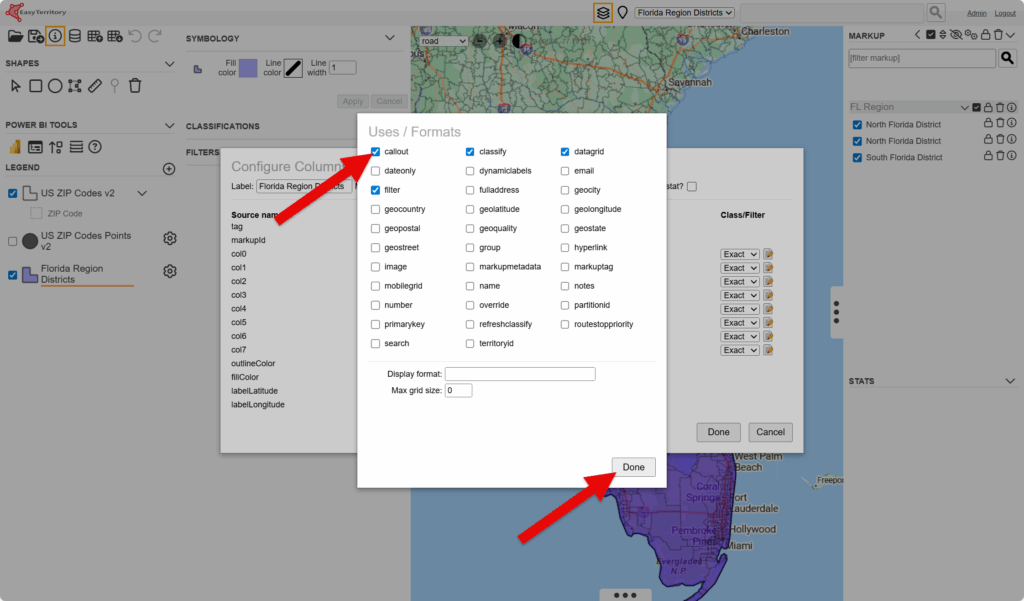
Step 4: To add or remove column as a callout, select the “Uses / Formats” value for the row of the target column. When the “Uses / Formats” dialog displays check or uncheck the callout checkbox and click “Done”.
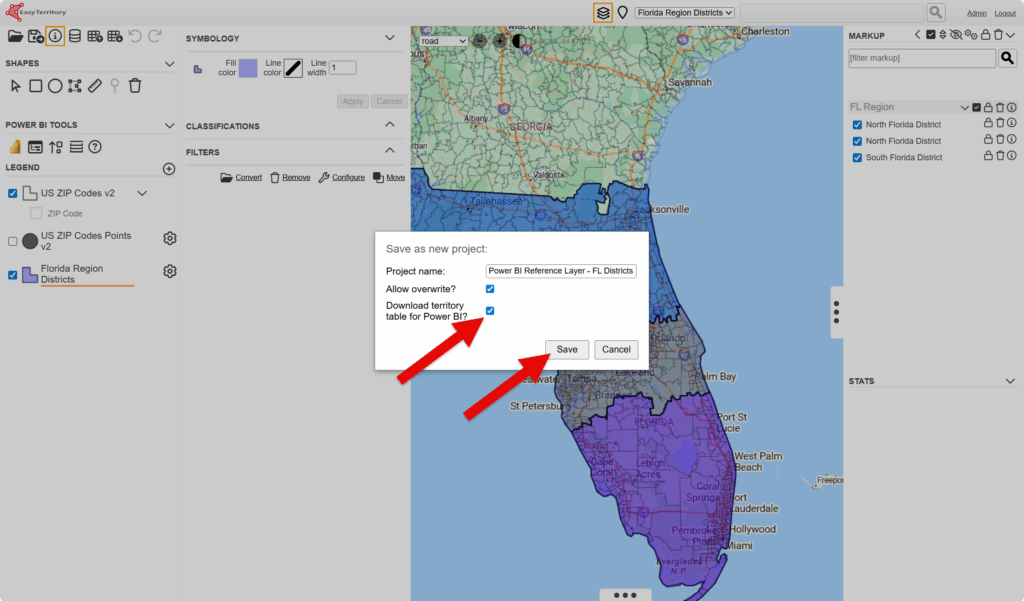
Step 5: Save your project and make sure to check “Download territory table for Power BI”
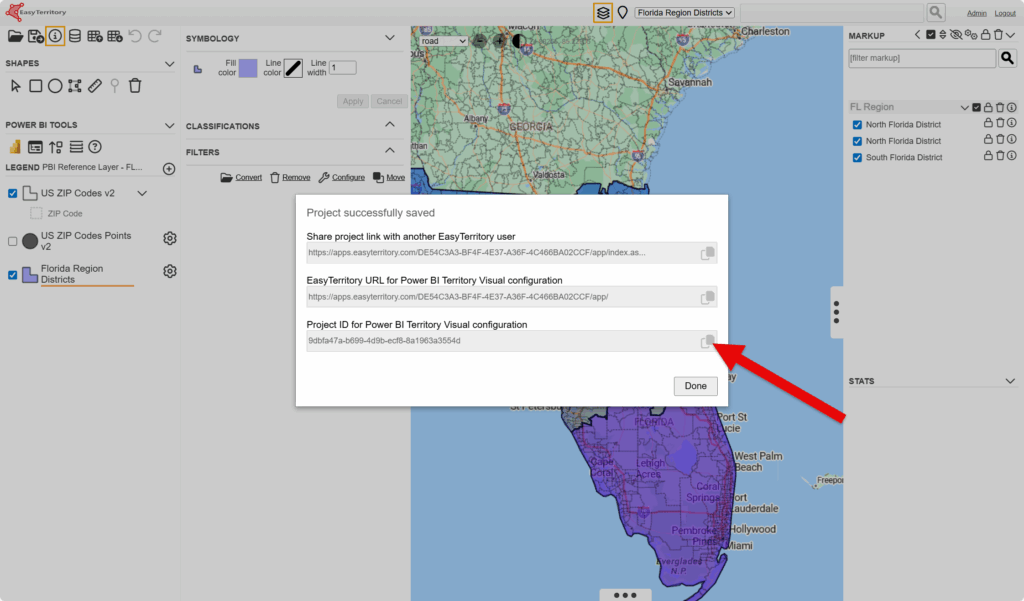
Step 6: After saving, copy the “Project ID for Power BI Territory Visual configuration” and click “Done”.
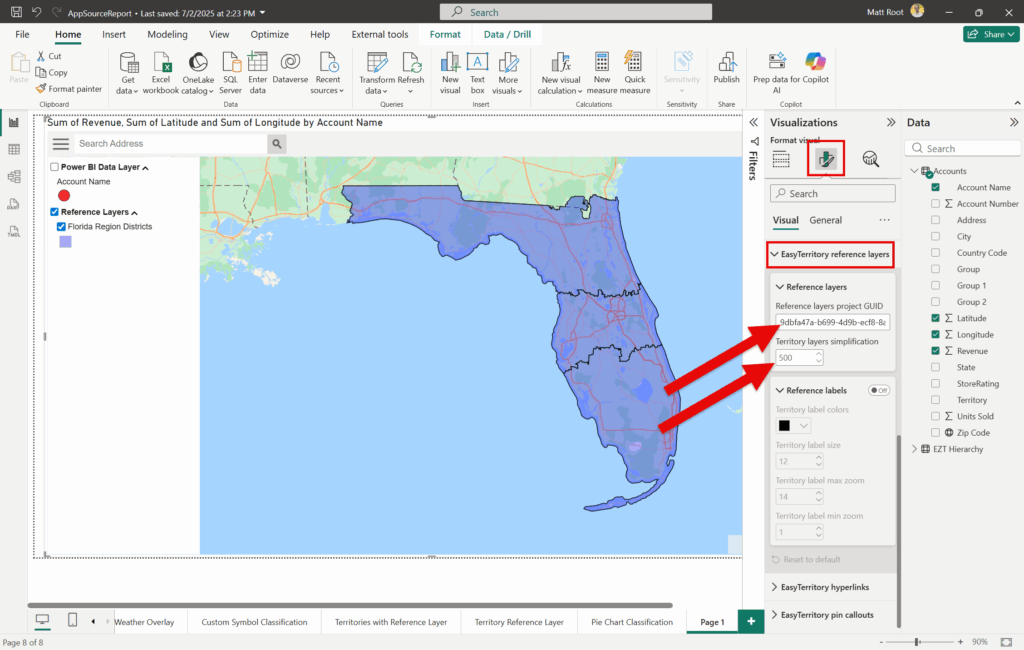
Step 7: In your Power BI report, select the EasyTerritory Visual and in the format panel, under the “EasyTerritory reference layers” section report paste the Project ID in the “Reference layers project GUID”.
- Optionally: in the “Territory layers simplification” field, set the desired simplification meters. The higher the number the more your polygons borders will be simplified.
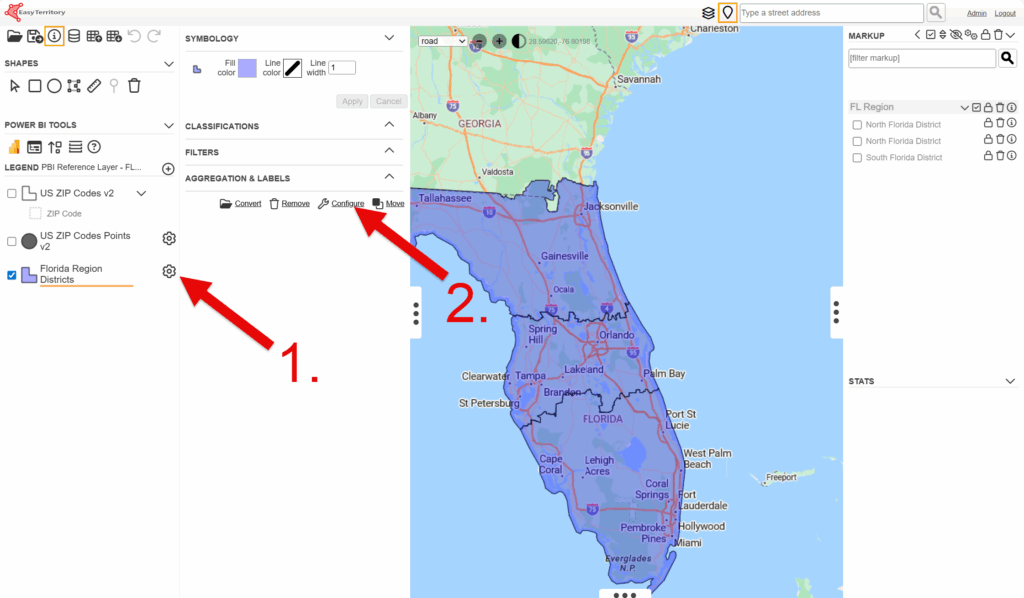
- Optionally: to display the labels, go to the EasyTerritory Web Application and in the layer, select the gear icon next to the your reference layer. This will open the settings panel. Next, click the configure button.
- Next select the uses and format value for the target column (refer to image in Step 3). When the “Uses and Formats” dialog opens select “dynamiclabels” and click “Done”. Once the dialog “Uses / Formats” closes, click “Done” in the Configure Columns dialog.
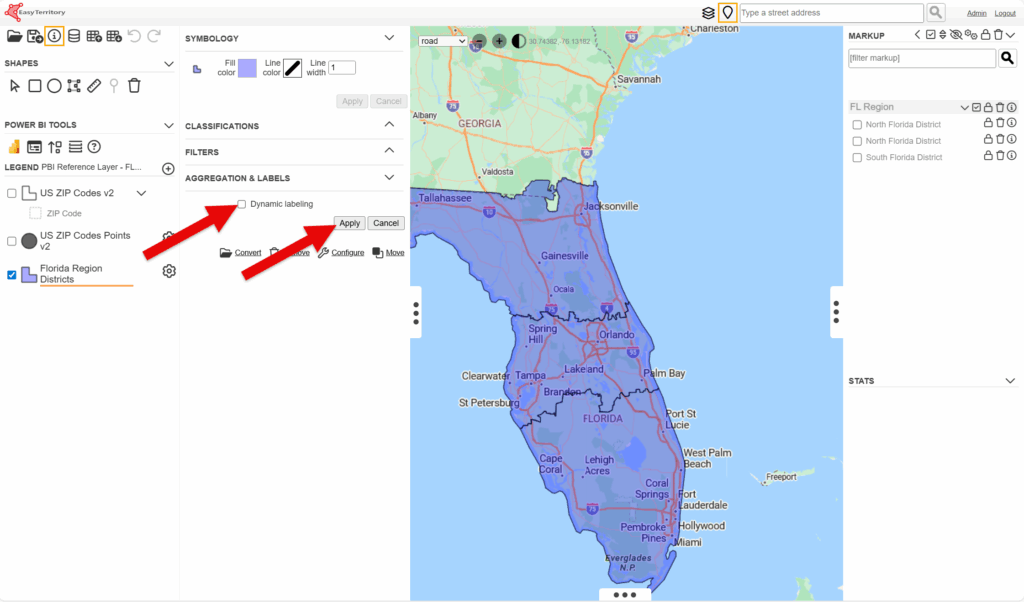
- Next, in the layer settings panel, under the “Aggregation & Labels” section check the “Dynamic labeling” checkbox and click “Apply”
- Finally save the project and reload your EasyTerritory Visual in your Power BI project.
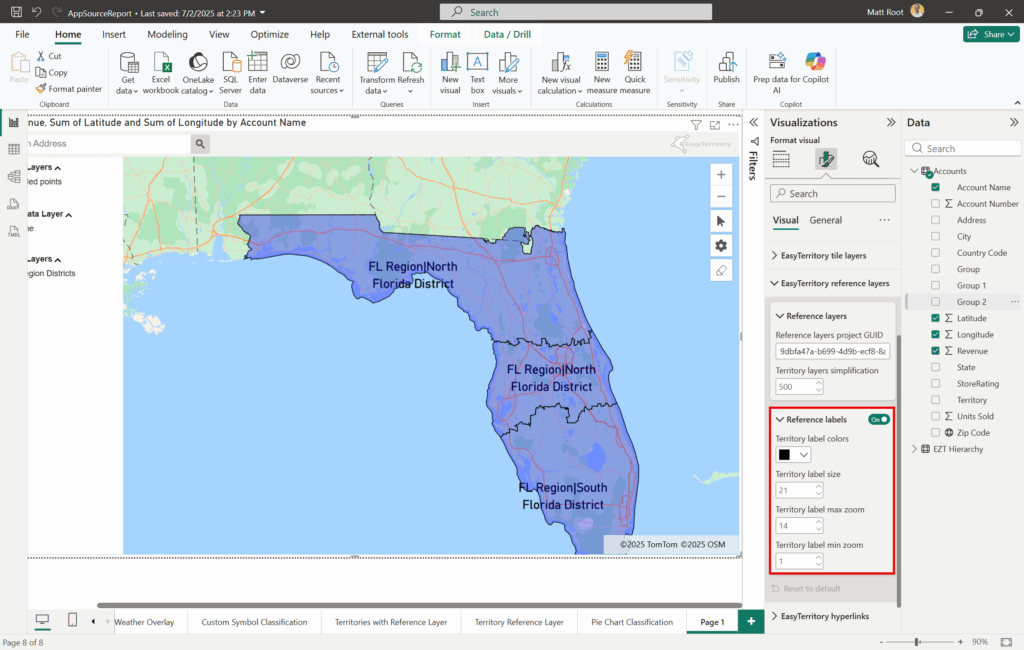
- Go back to your Power BI report and go to the EasyTerritory Visual. In the format panel, under the Reference layers section, turn on the reference labels (screen shot below) and configure the following settings:
- Territory label colors: set the color of the labels.
- Territory label size: set the size of the of the labels.
- Territory label max zoom: Sets the zoom level at which territory labels stop displaying. Higher values mean the map is more zoomed in when labels disappear.
- Territory label min zoom: Sets the zoom level at which territory labels are displayed. Higher values mean the map is more zoomed in when labels appear.
If you need any assistance, want to give suggestions, or overall feedback, please email us at [email protected]
