
The EasyTerritory Territory Visual for Power BI enables you to display, analyze, and interact with geographic territories directly within Power BI reports. Territories are authored in the EasyTerritory Territory Designer and rendered as polygon or point-based visualizations in Power BI.
Get started with EasyTerritory
EasyTerritory Territory Designer free trial
In this article
- Build your territory polygons in the Territory Designer web application.
- Load your territory data into the Power BI data model.
- Configure the Territory Visual in your Power BI report
Build your territory polygons
The Territory Designer is used to create the geographic territories that will appear in your Power BI report.
Available boundary layers
Territories can be built from a variety of standard boundary layers, including:
- ZIP Code (Postal Code)
- County
- State
- Country
- Point-based layers such as customer or asset locations
How territories are used in Power BI
EasyTerritory combines the selected boundaries into a single polygon per territory, which the Territory Visual in Power BI uses for:
- Territory map rendering
- Heat-map style classification
- Drill-through interactions
- Hierarchical rollups (e.g., Region → District → Territory)
Step 1. Build Your Territories
In the Territory Designer, build your territories following the steps in the video. Assign each territory a unique name so Power BI can correctly categorize them when you configure the Territory Visual.
Step 2. Optional: Configure Group-Level (Hierarchy) Polygons
If your territory data uses hierarchical groupings such as Region → District → Territory, you can create group-level polygon geometry to support drill-down in Power BI. You have the ability to create up to 6 levels of groupings.
In the markup panel of the Territory Designer select the info icon ![]() next to the territory name to add a group or multiple levels or groups to a territory.
next to the territory name to add a group or multiple levels or groups to a territory.
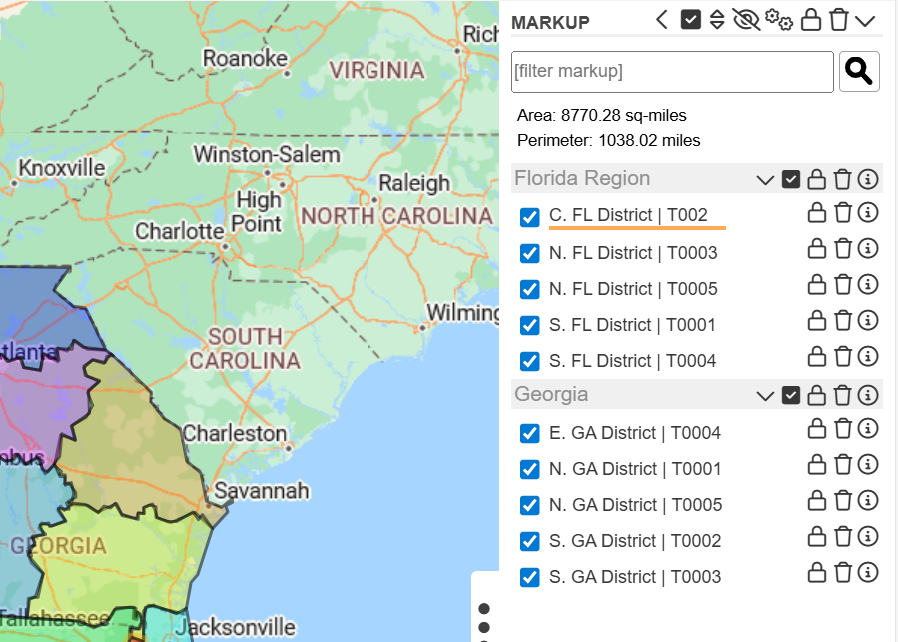
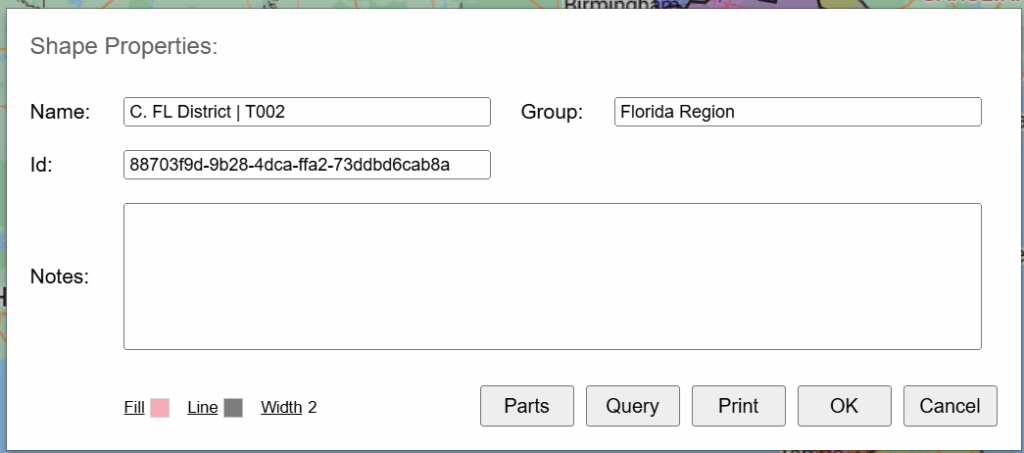
In the Shape Properties dialog, add your top-level group to the Group field. If you have additional hierarchy levels, enter each level from highest to lowest in the Name field, separating them with the pipe (“|”) character and ending with the territory name.
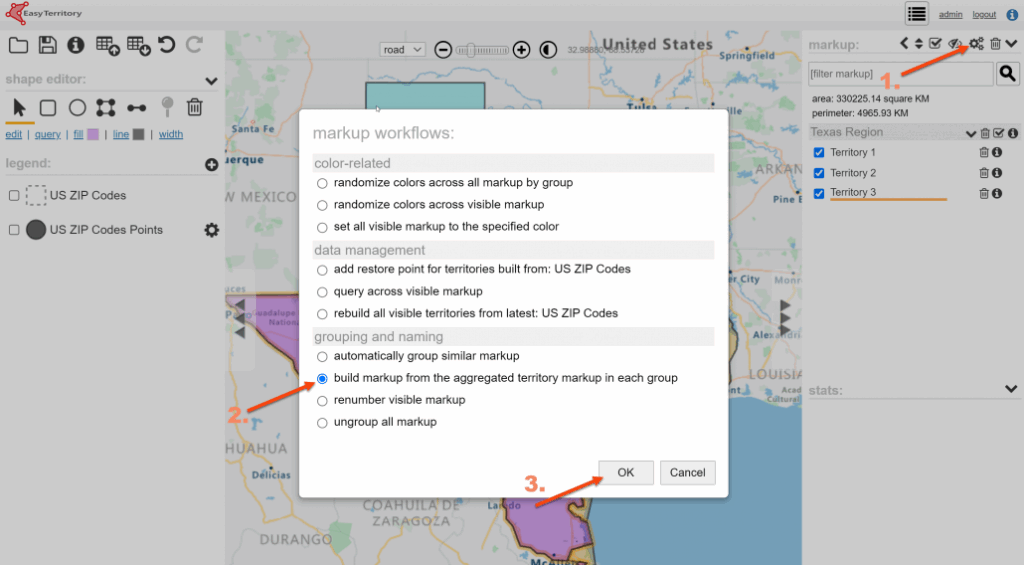
If Groups are configured, run the Group Territory Geometry workflow by selecting the ![]() icon.
icon.
This workflow creates the aggregated polygon shapes for each level of the hierarchy, enabling proper drill-down behavior in the Territory Visual.
Step 3. Save and Publish for Power BI
Once your polygons are finalized:
- Save the project
- Click “Publish for Power BI”
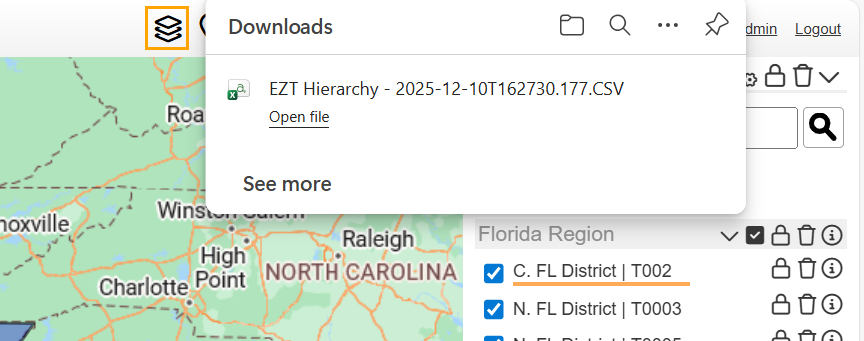
This action prepares the territory data for use in Power BI and downloads the EZT Hierarchy.csv file, which you can import into your Power BI data model.
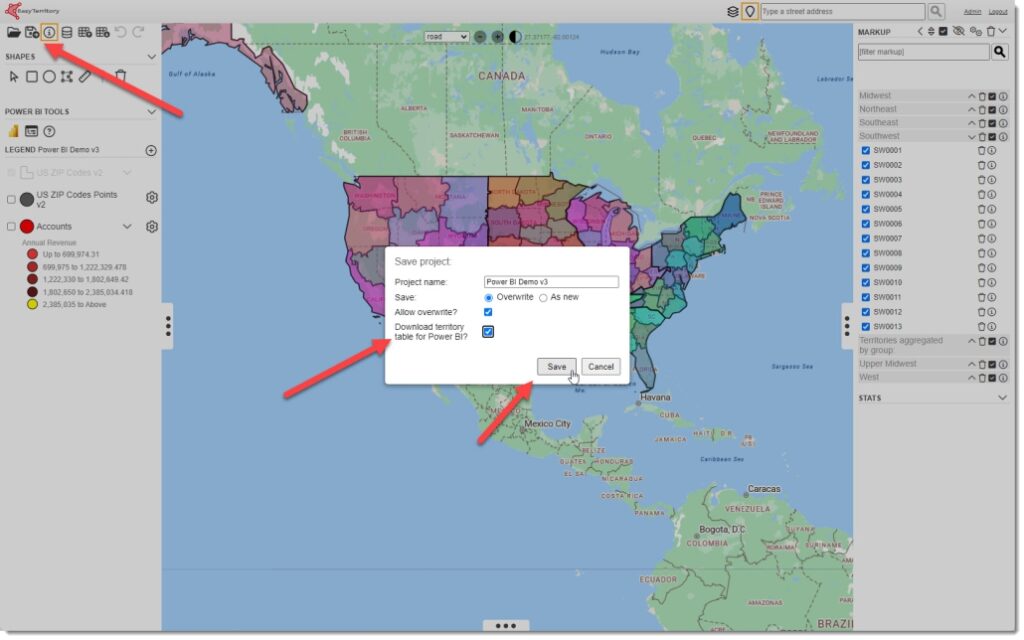
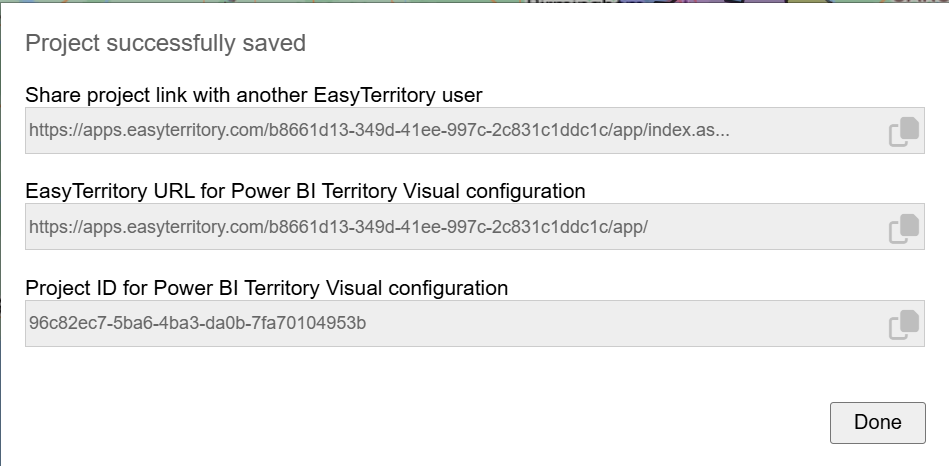
After saving the project, the Project Info dialog will open. Copy the Project ID for Power BI Territory Visual configuration, as you’ll need it later when setting up the visual in Power BI.
Load your Territory Data into the Power BI data model.
The method you choose depends on your needs. For quick, infrequent setups, you can simply import the EZT Hierarchy.csv file downloaded from EasyTerritory. If your territory data changes regularly or you require automation, the EasyTerritory Power BI Connector is the most robust option
Step 1. Import data into Power BI
Option A — Import the EZT Hierarchy.csv file
After completing Step 2 in the Build your territory polygons section and saving your project, EasyTerritory will download a CSV file called EZT Hierarchy.csv to your computer.
This file can be imported into your Power BI data model by selecting Get Data → Text/CSV and choosing EZT Hierarchy.csv within Power BI. After this step you can continue to Load the EZT Hierarchy Table.
Option B — Configure the EasyTerritory Power BI Connector
Install the Connector
- Download the EasyTerritory Connector.
- Place it in your Custom Connectors directory (typically
Documents\Power BI Desktop\Custom Connectors). - Enable uncertified connectors in Options → Security if required
Connect to EasyTerritory
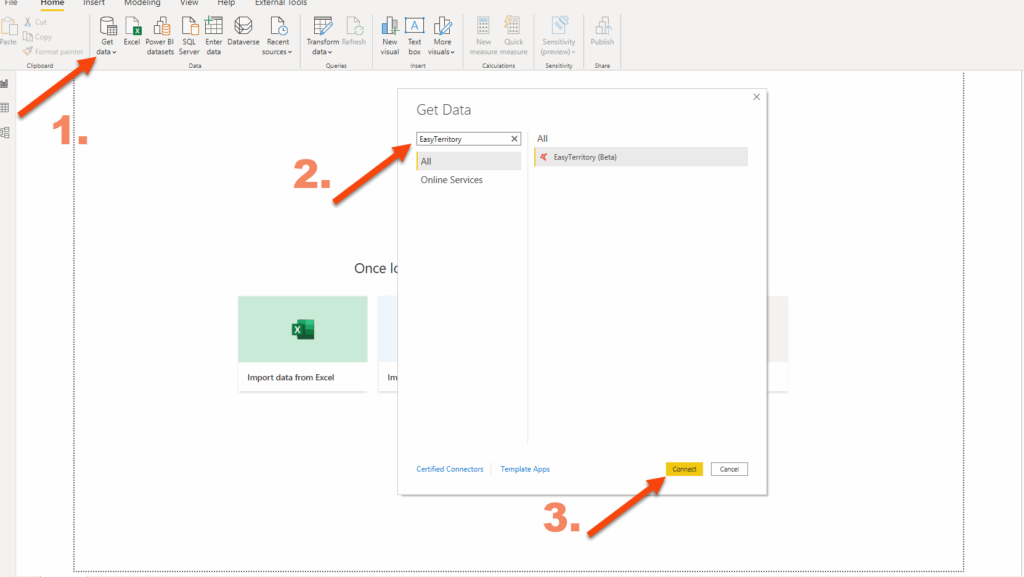
- In Power BI Desktop, choose Get Data
- Search for EasyTerritory
- Select the EasyTerritory Connector
- Click Connect
Enter Required Connection Settings
Provide the following values when prompted:
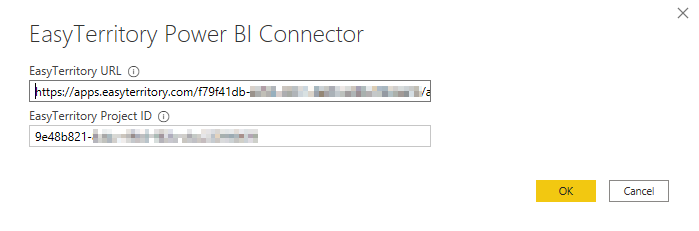
- EasyTerritory URL
- Project ID
- Service Username
- Service Password
Creating a Service User
A service user is recommended for reliable Power BI Service refresh.
To create one:
- Sign in to the Territory Designer as an administrator
- Navigate to Admin Settings → Application Settings
- Set a Service User and Service Password
- Click Save
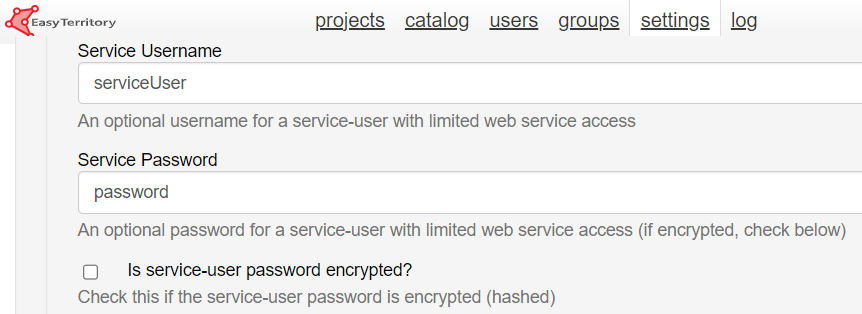
Passwords are encrypted; EasyTerritory Support can store a hashed version if needed.
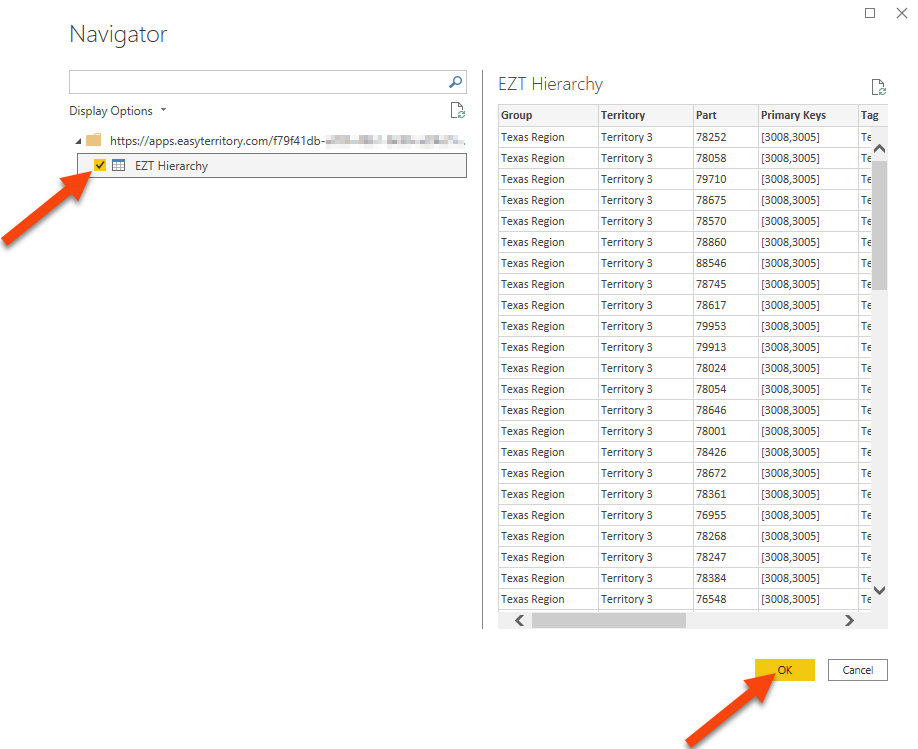
Step 2. Load the EZT Hierarchy Table
Select EZT Hierarchy from the connector output.
This table contains:
- Group, Territory and Part Names — Names used to identify each group and territory within your hierarchy.
- Primary Keys — Unique identifiers that link your Power BI data to the corresponding territory geometry.
- Part-Level Coordinates — Latitude and longitude values used to display point-based (part-level) data within territories.
Part-level points represent the underlying geographic components that make up your territories, as described in Step 1. These points are displayed in the visual as center points. Optionally, you can use your own account data as the source for part-level points. See this page more info.
Load the table into Power BI and confirm there are no errors.
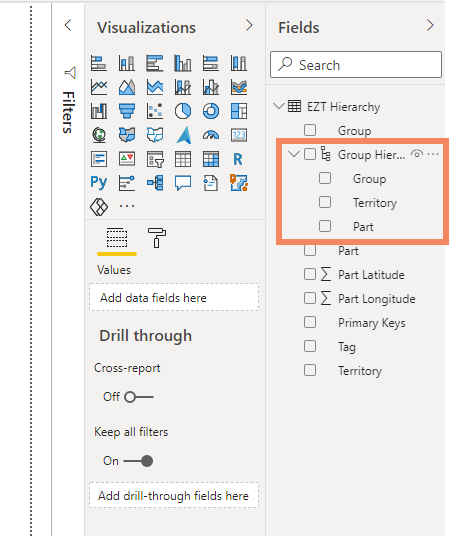
Step 3. Optional: Build a Hierarchy in Power BI
If your project includes multiple hierarchy levels:
- Right-click the top-level field (e.g., “Region”)
- Choose Create Hierarchy
- Add additional levels (District, Territory, etc.)
This enables drill-down functionality within the visual.
Configuring the EasyTerritory Territory Visual in Power BI
After your data model is loaded, configure the visual so it can map your fields correctly.
Step 1. Add the Visual
- Open the Visualizations pane
- Select the three-dot menu
- Click Get more visuals
- Search for EasyTerritory Territory Visual
- Add it to your report canvas
Step 2. Assign Required Fields
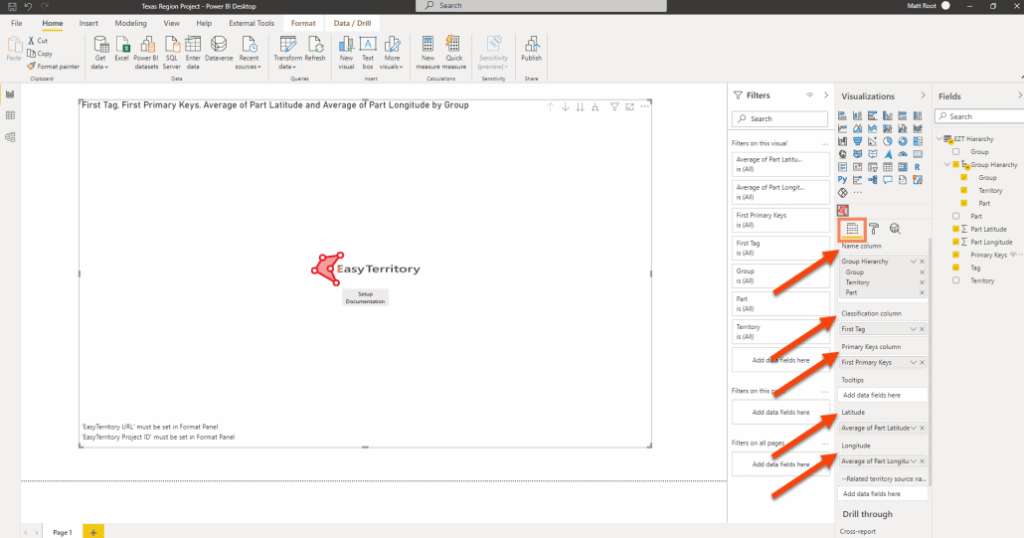
With the visual selected, populate the following fields:
Name Column (Required)
The field representing the territory name (can also be a hierarchy field).
Classification Column (Required)
A numeric or text field used to categorize or color-code territories, such as:
- Sales totals
- Category values
- Performance metrics
Primary Keys (Required)
Must map to the Primary Keys field from the connector.
This links Power BI data to EasyTerritory geometry.
Latitude & Longitude (Optional)
Used only if you are displaying part-level points.
- Part Latitude → Latitude
- Part Longitude → Longitude
Step 3. Configure Format Options
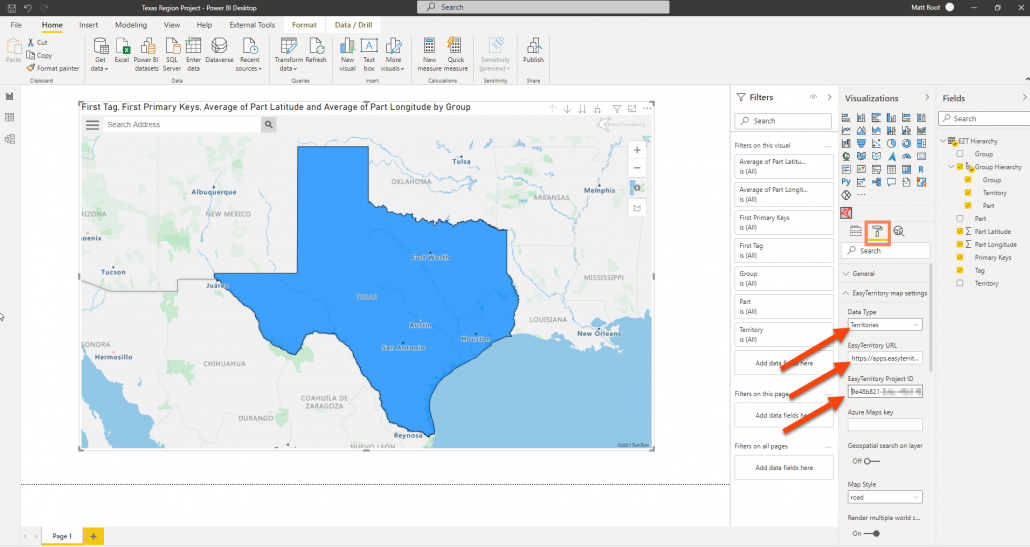
In the visual’s Format panel, configure the following:
Data Type (Required)
Select:
- Territories — to render polygon shapes
- Points — to render point-based records
EasyTerritory Enterprise URL (Required)
Your instance URL:
https://apps.easyterritory.com/{GUID}/{Site}
Project ID (Required)
Enter the Project ID from your EasyTerritory environment.
If you need any assistance, want to give suggestions, or overall feedback, please email us at [email protected]