
The EasyTerritory Territory Visual supports displaying point-based data using latitude and longitude values. This page explains how to configure the visual to display points, and optionally how to display territories together with points in the same report.
In this article
- Configure the Territory Visual to display points
- Display territories with point data (optional)
Configure the EasyTerritory Territory Visual
Create and populate the required visual fields to display point data in a Power BI report.
Step 1. Add the Territory Visual
Add the EasyTerritory Territory Visual to your Power BI report by selecting Get more visuals in Power BI Desktop and searching for EasyTerritory.
Once the visual is added to the report canvas, select it to begin configuration.
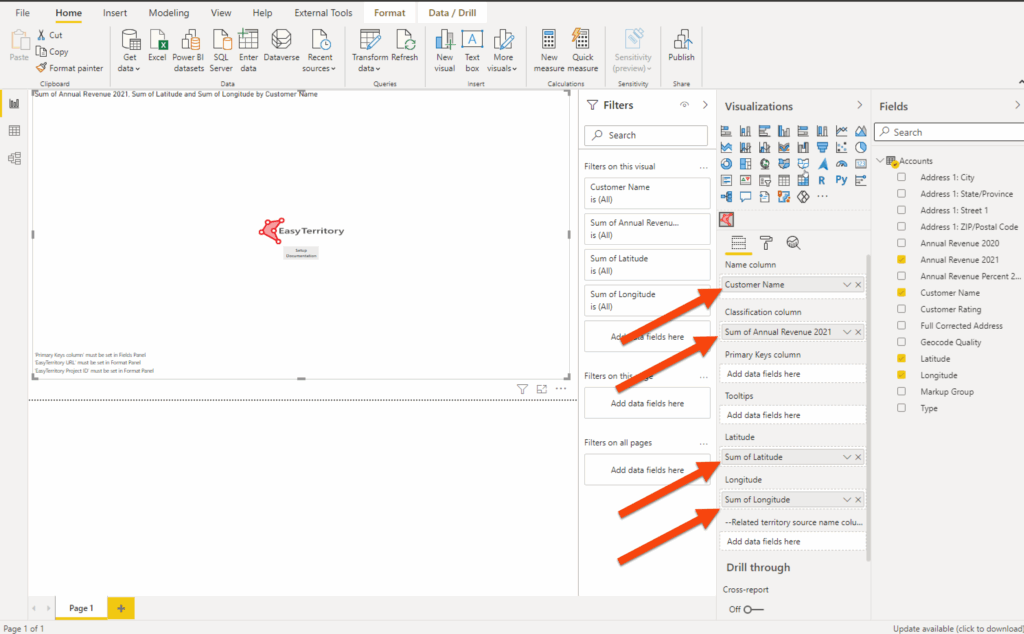
Step 2. Assign Required Fields
With the visual selected, populate the following fields.
- Longitude
Longitude value for each point. - Latitude
Latitude value for each point. - Name Column
The name used to group your data. This can optionally be a hierarchy. - Classification Column
A numeric or text field used to determine classification or grouping.
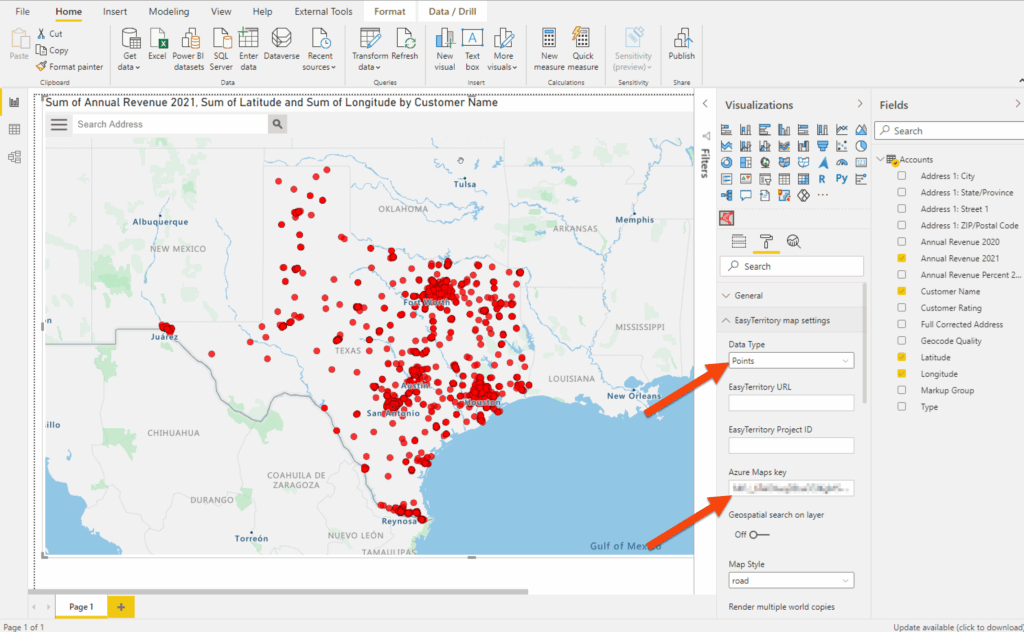
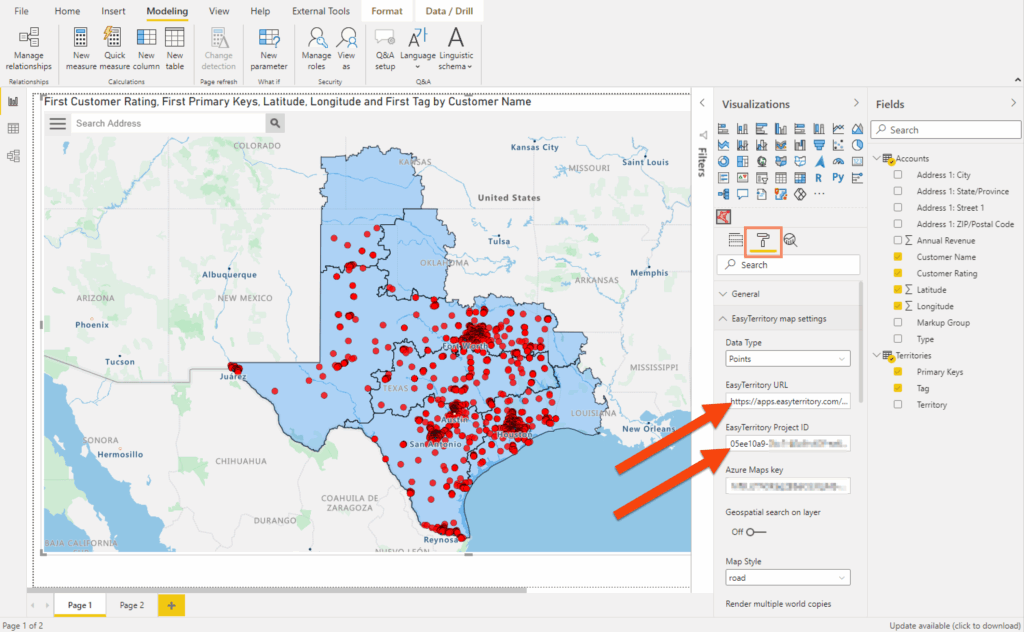
Step 3. Configure Format Options for Points
Under the Format panel, configure the following:
- Data Type (Required)
Select Points when displaying latitude and longitude data. - Azure Maps Key (Optional)
Enter your Azure Maps key.
If you have an EasyTerritory Web Application subscription, the Azure Maps key is obtained automatically when you enter your EasyTerritory URL. - EasyTerritory URL
Enter your EasyTerritory instance URL:https://apps.easyterritory.com/{GUID}/{Site}Important: To obtain an EasyTerritory Web Application trial, you must register first. - Project ID (Optional)
Enter your EasyTerritory project ID if you plan to load territories.
Optional: Display Territories with Point Data
You can optionally configure the visual to display territory polygons together with point data.
Step 1. Create Territories
Create territories in the EasyTerritory web application. An active EasyTerritory subscription is required.
Step 2. Build Territory Polygons
Build territory polygons in the EasyTerritory web application following the standard territory configuration steps.
Step 3. Load Territory Data into Power BI
Load your territory data into the Power BI data model using the EasyTerritory Power BI Connector.
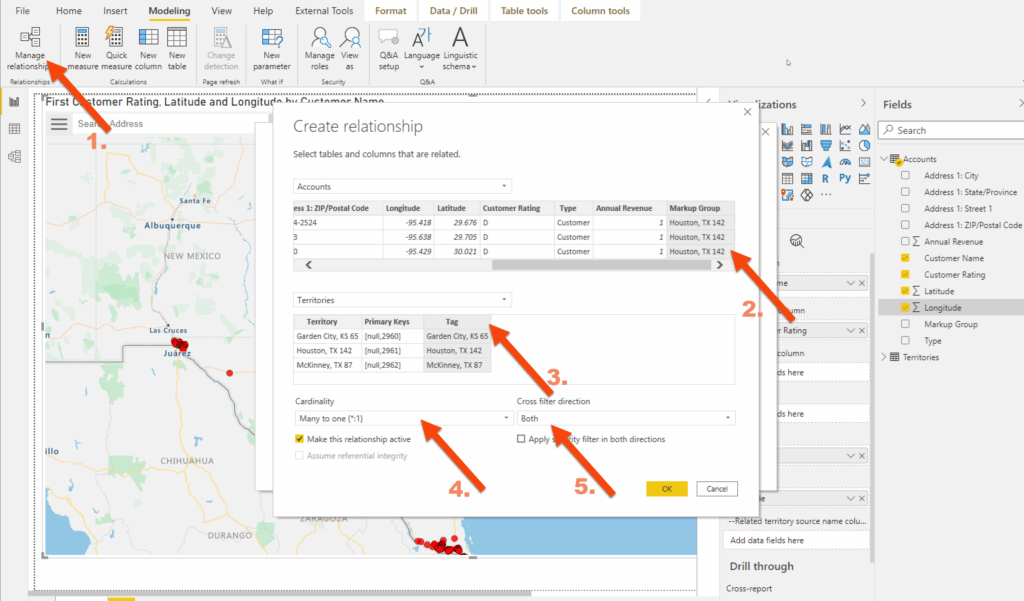
Step 4. Create Relationships
Create a relationship between your point data table and your territory data table in Power BI.
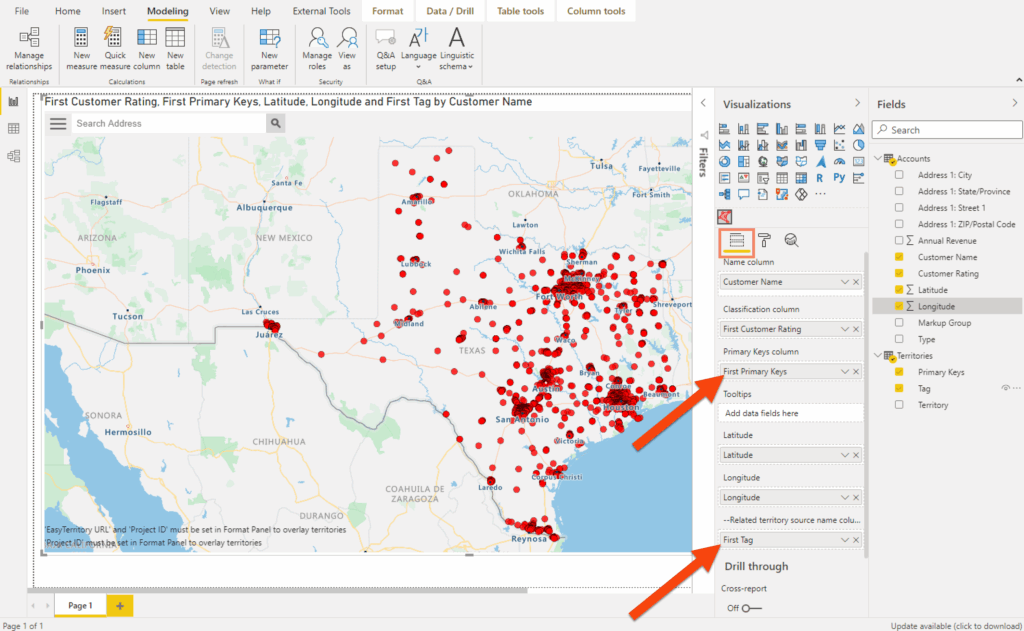
Step 5. Assign Territory Fields
With the visual selected, under the Fields panel add the following fields from your Territories table:
- Primary Keys
The text field provided by the EasyTerritory Power BI Connector.
This field maps territory names to the geometry stored in EasyTerritory Enterprise and must always come from the connector output. - Related Territory Name Column
The text field from your territory table that contains the territory name.
Step 6. Configure Territory Settings
Under the Format panel, enter the following required values:
- EasyTerritory URL
https://apps.easyterritory.com/{GUID}/{Site} - Project ID
Your EasyTerritory project ID.
Notes
- When displaying points only, the Project ID is optional.
- When displaying territories with points, the Project ID and Primary Keys fields are required.
- Latitude and longitude fields must be numeric and not aggregated.
If you need any assistance, want to give suggestions, or overall feedback, please email us at [email protected]